Anecdotally it is common to hear, within the telecommunications industry, that telephone call volumes decrease during hot days, colloquially when everyone goes outside to the beach!
Naturally, where temperatures are lower, it is believed that consumers and business people are more likely to remain in the homes or place or work, resulting in more telephone calls being made.
Introduction
In early 2012, in a discussion with a colleague regarding their company s call volumes, we arrived at the topic of whether call volumes and durations varied with the weather. Whilst focused initially on inbound calls from business and residential security systems, the query can be extended into the more wide ranging scope of voice calls from both fixed line and mobile (cellular) networks.
This analysis aims to quantify and demonstrate the validity (or lack of) of this anecdote, by measuring average call volumes against publicly available climate data.
Consumer (also known as domestic or residential) call volumes are extremely inconsistent, as individuals are rarely at their home at the same time or for the same length of time every day, it was decided to base this report only on business-grade fixed line telephone services, which are offered to businesses of varying sizes.
Method
Collection of data was first performed via an extract of anonymized call records from a telecommunications provider, and climactic weather data from the Bureau of Meteorology. This data was provided in a pipe delimited format, and imported into a clean database created in Microsoft SQLServer 2012.
To identify the number of calls being made, it is important to ignore variances in the number of customers. Variances are typically due to a number of factors, including:
- New customers mid-month
- Ported-away customers (those moving to another carrier)
- Suspended, disconnected or terminated customers
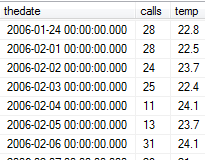
The source data was provided in a format similar to this:
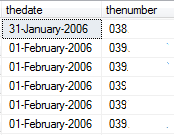
Therefore, an SQL query was written to return the total (SUM) number of calls per day per originating telephone number within the geographical region. The results were similar to the following:
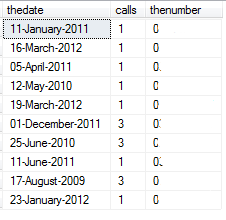
This data was then aggregated into the average calls per originating telephone number per day, which approximates the average calls for a customer per day during the period reviewed.
The resulting data set shows a subtle range of averages per day as per the table below. The total number of calls per day is also shown, to demonstrate the validity of the data.
As expected, calls on the weekend are dramatically lower, so will be excluded in the final results.
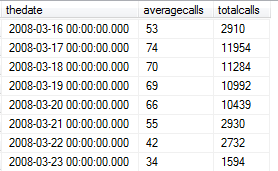
The dates 16th, 22nd and 23rdmarch above are those that fall on a weekend weekends.
The next step involved importing the daily maximum temperature data, as published by the Bureau of Meteorology. These resulted in a new data set:
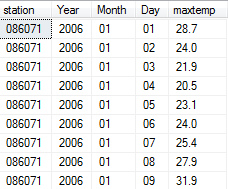
We then merge the three data sets into two data sets,Temperature by Day against Total calls and Average Calls and Average Duration by Day.
The data set resulting from the super-set of temperature by day and calls by day resembles the following example:
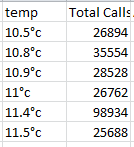
This data was then pivoted to provide a summary of total calls per measured temperature point.
Results
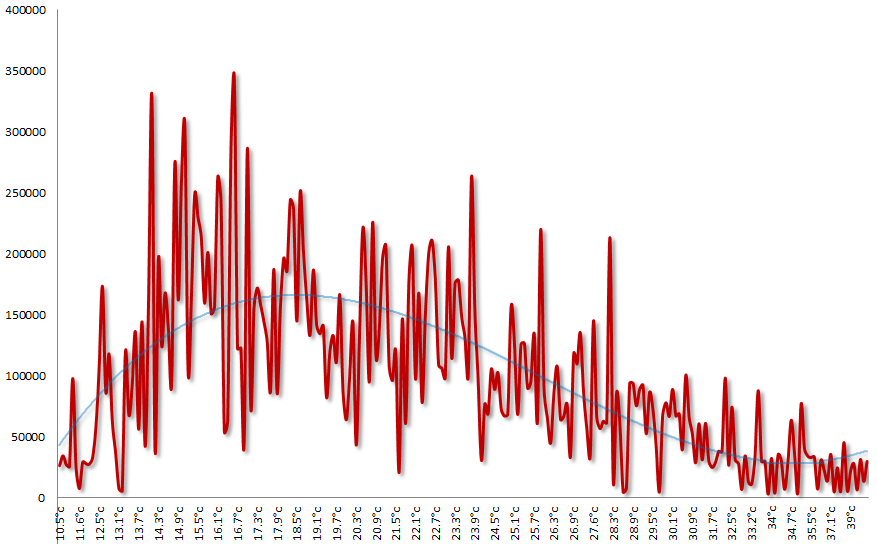
It can be seen from the graph below that call volumes are indeed reflective of daily temperatures. A number of conclusions can be made from this data.
|
Range
|
Observation
|
Possible Explanation
|
|
Below 14 c
|
Erratic and low volume of calls
|
Tends to be during early mornings, when less people are awake or at work.
|
|
14 c-25 c
|
90% of all calls are made between what is typically regarded as average temperatures of 14 c-25 c
|
The beach doesn't look too attractive, so people stay at work.
|
|
22 c-34 c
|
Call volumes begin to decline steadily from 22 c, plateauing at around 34 c
|
People are clearly starting to leave for the beach.
|
|
34 c-37 c
|
Call volumes are at their lowest between 34 c and 37 c
|
Is this the ideal range to visit the beach?
|
|
Above 37 c
|
Above 37 c and call volumes begin to increase
|
Is it too hot for the beach?
|
For the purposes of simplicity, a polynomial trend line has been added to illustrate the overall call volume trend against temperatures.
Internationalization
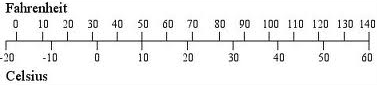
For those in countries yet to adopt the Celsius temperature measurement scale, a comparison chart is shown below to help translate temperatures.
Discussion
Whilst these results are by no means an accurate representation of global telephony trends under varying climatic conditions, nor even localised trends to Australia, it is an interesting exploration of a subset of data and the impact the weather has on the behaviour of business people in Melbourne, Australia.
The call usage data was sourced from a single telecommunications provider, and is arguably on a small window into the call usage of the entire regional of Melbourne, Victoria, Australia. Having said that, the telecommunication provider offers services to business of a similar price and quality to its competitors, so it can be assumed the usage trends are relatively consistent with the overall market.
Future Actions
If other telecommunications providers were prepared to share anonymized data, this analysis could be extended significantly. Regional call data is already available for all of Australia using the current provider, however adding others would increase accuracy.
Climate data for the entire country of Australia is readily available from the Bureau of Meteorology, and is updated on a daily basis.
A whole-of-country analysis could be performed with sufficient cooperation of telecommunications providers and with appropriate computing resources being made available.
References
Source data for this report was provided by the Commonwealth of Australia s Bureau of Meteorology, Climate Data Online web site (http://www.bom.gov.au/climate/data/)
Daily Temperature values were derived from measurements taken in:
- Town: Melbourne VIC, 37.85S, 144.98E
- Bureau Station: 086232 Melbourne Botanical Gardens
Call usage volumes were anonymized and provided by a client. A total of 31,707,055 calls for the geographical region above were analysed. Disclaimer – these calls are not sourced from my employer or any related entity.
All customer, location and originating carrier and tariff data was removed, and only call counts per period was provided.
Due to the possibility of local number portability, we must assume an error rate of +/- 10% as it is possible some calls are made from outside the geographic region specified.
Tags
IT,
MadScientist,
Science